A first look at Mongolian crime data
Note from April 2021: The crimemap referenced in this no longer works. It seems the government of Mongolia is no longer supporting this project.
A few months ago I stumbled across a very interesting site made by the Mongolian national police that allows you to map crimes all around Mongolia. At the same time I was introduced to Google Data Studio, a relatively new product from Google that allows you to create dashboards from live data. I thought it was a natural fit to mash the two together and make an attempt at a “Mongolian Crime Dashboard”. The rest of the article I will explain about this dataset, its features, and how I mashed it up with Data Studio.
If you are interested in viewing the dashboard click here or you can read on to see my dive into the data.
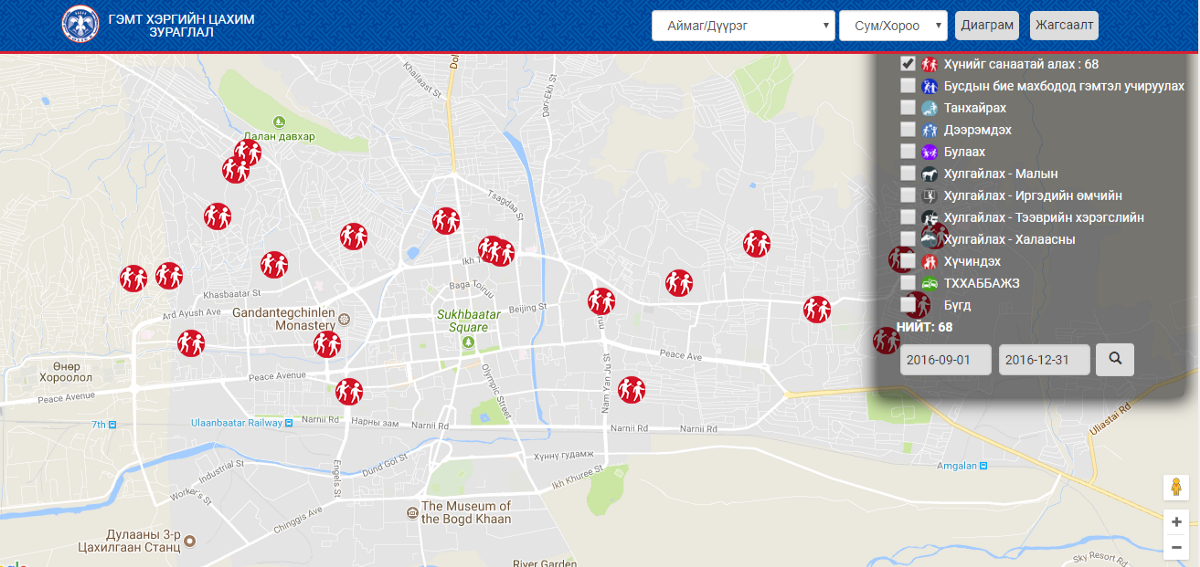 What the Mongolian Crime Map looks like. Looks amazing but the locations are suspect. Source: http://crimemap.police.gov.mn
How the Mongolian Crime Map Is Different
At first glance the Mongolian crime map was similar to crime maps of Chicago. You can visualize categories of crime over a specified time and it shows the locations of each crime. But the Mongolian data are less complete and messier than what would be ideal. The fields include the crime type, report number, date of report, location data down to the khoroo (neighborhood), and police station. However a few differences are clear when I dug in deeper.
First of all the location data used to map the crimes on the map do not appear to be entirely reliable. Crimes appear to be mapped outside of their areas in some cases. Some crimes appear in entirely different countries. For example I found two crimes in Europe, a few in Siberia, and a few in China. So I determined using the mapped coordinates was a less than perfect way to use this data.
Second is the report location. It is a text field with the city/province, soum (like a county), district, and khoroo (sub-district / neighborhood). All of these details are separated by commas or spaces, with quite a bit of variability. I was able to use some regex functions in good old Excel to clean it up. Not ideal but workable.
Last is the time period available. Only 2015 and 2016 appeared to be complete. 2014 and 2017 seem to be incomplete as the total number of crimes is quite a bit lower. As such I focused on 2015–2016 for the dashboard. My theory as to the incomplete data for 2017 is either that they haven’t entered the reports or they only enter cases that are closed after a certain period of time. Either way it should be understood that there may be some missing data in the years 2015–2016 as well.
Mongolia’s National Statistical Office
Mongolia’s National Statistical Office (NSO) does a great job of collecting crime totals as well. However their data are only reported down to the soum/county (outside Ulaanbaatar) or district level (inside Ulaanbaatar). This makes comparing neighborhoods difficult as some districts are quite large. Nearly 50 kilometers long in some cases.
 Map of Ulaanbaatar districts. This is the smallest unit the NSO records crime data for. Credit: The Mongolist
A major advantage is the NSO has complete data from 2010–2015, much longer than what is available from the Mongolian Crime Map. This historical data could be very valuable in things like crime forecasting, which could be very helpful in policing. However this historical data is compiled yearly so we would be unable to see trends outside of year to year.
The Dashboard
Google has come a long way since launching Data Studio last year, and the product is still in beta (per usual with Google). It is already a very powerful tool and clear competitor to Microsoft’s Power BI. Even things like geo maps are relatively simple to make and are well documented. These are normally challenging to make as most software is geared to the developed world.
 Mongolian crime dashboard. Google Data Studio is limited to mapping down to the province level.
Time series look great and are easily filterable, although are a bit messy.
 Comparing Ulaanbaatar crime to provincial crime for Q4 2016.
It is important to note that much of the labels are in Mongolian, but Google Translate does a pretty good job on most of the labels if needed. If you would like to view it in Data Studio click here.
Have suggestions or comments? Feel free to drop a comment below.
MDS Newsletter
Thank you for reading. Mongolian Data Stories has a free newsletter! To receive new articles straight to your inbox so you never miss out, click here to sign up.
