The rent is too darn high. Right?
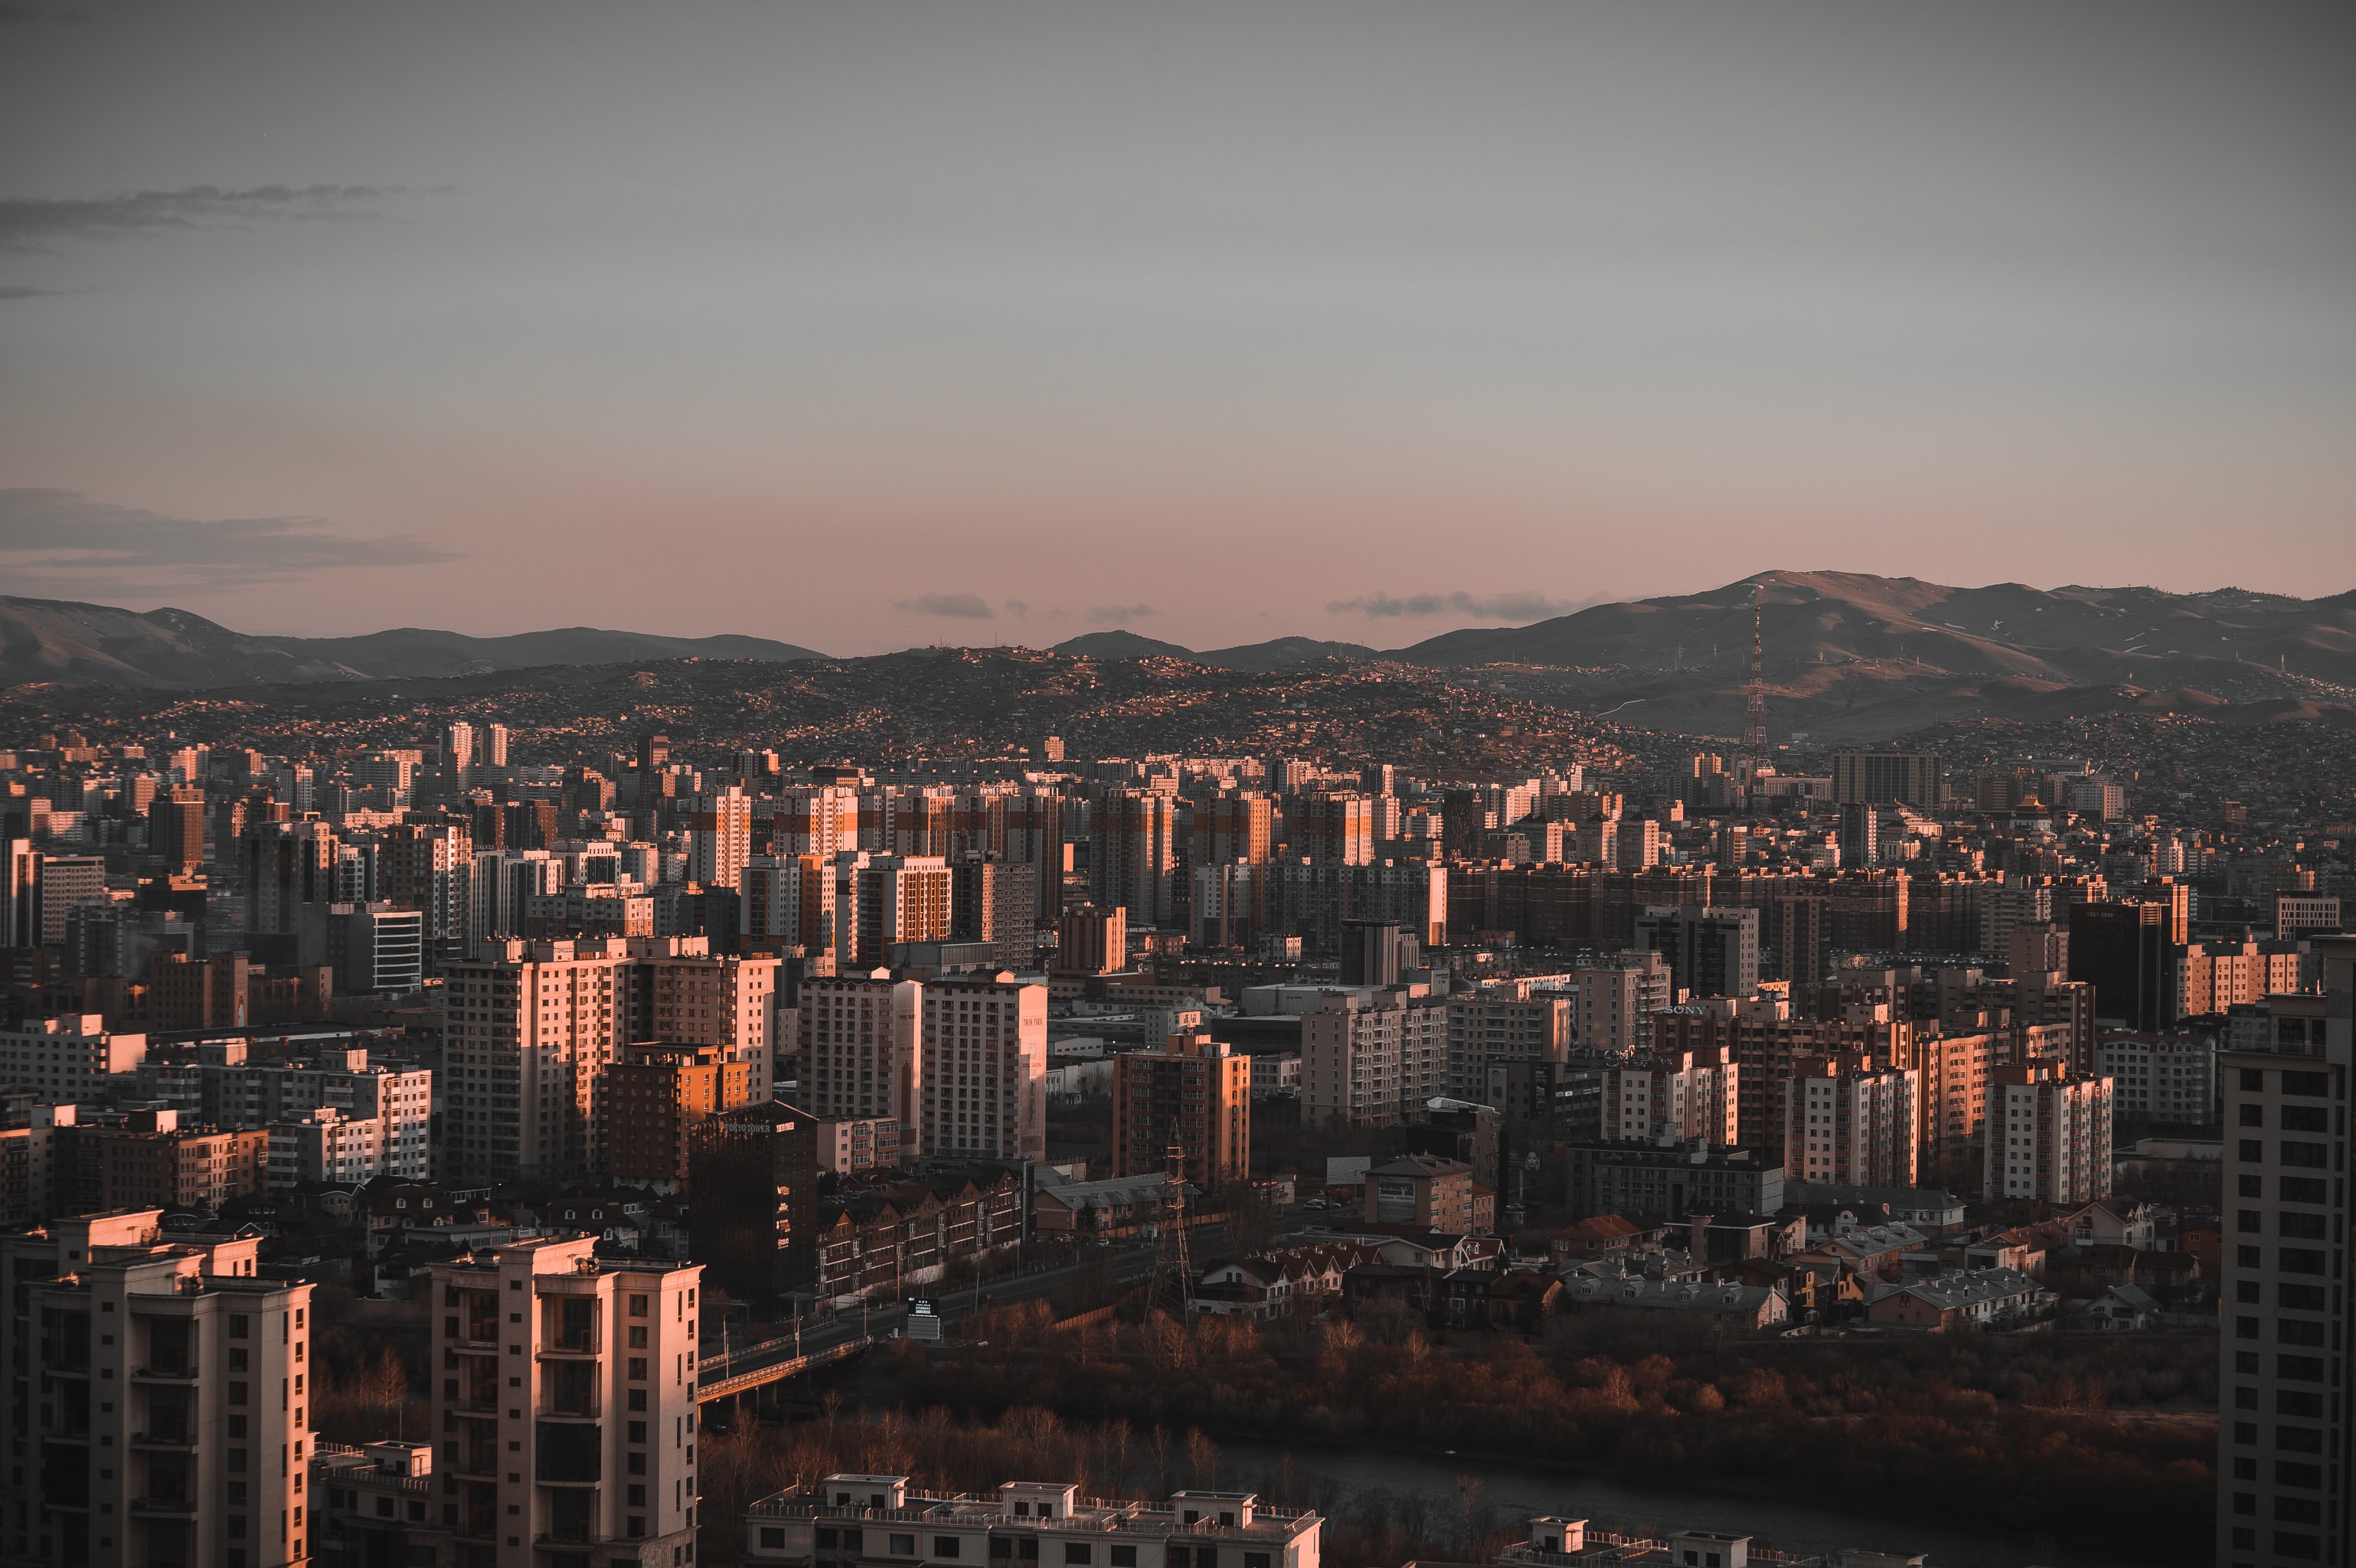
It’s hard to think of something more at the core of society than the family dwelling. It’s where you hang your hat, put your family possessions, and spend time with the ones you are closest to. For many families in Ulaanbaatar, this means an apartment in a multi-level building.
As children grow up, get married, and have children of their own (but not always in that order), families often scrape together enough money to purchase an apartment for the budding young family to start their lives together. It sounds quite idylic, something akin to a “Mongolian Dream”, rivaling the American one.
It’s easy to argue that this Mongolian Dream is a false one, propped up by a highly profitable construction sector, but that’s not what I’m here to do. I’m here to answer a Tweet. That’s right, a Tweet. Perhaps you get motivated by lofty ideals or a sense of justice. I tend to pay attention to Twitter too much.
@RobertERitz do you want to take a crack at this? Median income is with NSO, average flat price index is with @TenkhlegZuuch and MIK group company
— Эрдэнийн ЛХАГВА (@Lkhagva) September 24, 2021
Following the Evergrande debt crisis, Bloomberg published an article showing the price to income ratio for various Chinese cities compared to well known cities around the world. I was asked to take on this chart and see how Ulaanbaatar stacks up with the rest of the world.
First let’s define how the price to income ratio was created. The data for this chart came from Numbeo, a living costs data aggregator. Numbeo uses a simple formula consisting of the ratio of average price per square meter and average salary. They assume an apartment size of 90 square meters and they take 1.5 times the average annual net salary as a measure of net disposable family income. This 1.5 number assumes an average of 2 earners in a family with 50% of the women participating in the workforce.

These assumptions might not apply well to Mongolia, but we can address these later. By having a consistent methodology we can compare all of these countries on housing affordability. Conveniently, Numbeo actually does calculate the price to income ratio for Ulaanbaatar. All put together, here is the chart from mid-2021.

Being towards the bottom of the chart, Ulaanbaatar does not look too bad next to the ultra expensive cities in China. But look at the two cities Ulaanbaatar is more expensive than in this list. New York and San Francisco!
Siri, recalculate that for me
Let’s take a step back. How sure are we that these numbers are accurate? Using local and reliable data sources, I wanted to calculate the price to income ratio to verify that the result from Numbeo is accurate.
Digging around for data, there are a few issues with the price to income ratio as calculated by Numbeo. First, it is not clear whether Numbeo is using average or median salary in its calculation. In Mongolia the median salary is substantially less than the average salary.

This is due to a small number of high earners skewing the average higher while the median (or middle) salary is lower. While average salary data are available for both Ulaanbaatar and the national level, data for median salary are only available at the national level from the National Statistics Office of Mongolia.
It is also important to note that generally when a median is much smaller than an average, the mode (the most common observation) is generally even smaller than the median. Given these facts we probably should not consider the statistically average Mongolian to actually be very average at all.
The second issue is related to the price per square meter of housing. In countries like the United States the average price of housing would include apartments for purchase, smaller multi-family dwellings, and single family units. In Ulaanbaatar, when the price of housing is discussed it almost always refers to the price of apartments, not single family units. Yet 50% or more of the population of Ulaanbaatar does not live in apartments. So any ratio we make with the available data would be limited in scope to apartments and not the full spectrum of housing available in Ulaanbaatar.
With these issues in mind we can calculate a price to income ratio using available data. I used the same formula as Numbeo to keep things consistent.
- Average Ulaanbaatar salary for Q2 2021 via 1212.mn: ₮1,433,100
- Average price per square meter of apartments for Q2 2021 in Ulaanbaatar via Doljoo from Tenkhleg Zuuch on Twitter: ₮2,647,076
- 10% Income Tax + 13.5% Social Insurance = Tax rate of 23.5%
Putting it all together we can take the average price per square meter multiplied by 90 square meters to get the average price of an apartment. Then we take the monthly net salary (average salary minus taxes) and multiply it by 12 months. Then multiply by 1.5 to get the estimated family income. All together:

The result? 12.07. This is a bit above the Numbeo ratio, but not by much. We should consider their number reasonably accurate given the issues we outlined above. Put simply, the “average” Mongolian family, which isn’t actually very average, will pay more for an apartment in relation to income than an average family in New York or San Francisco.
90 Square Meters? You rich bro?
If you keep up with things in Mongolia, you will know there is also an issue with using the assumed 90 square meters for an apartment. First, the government mortgage program allows a maximum size of 80 square meters. Second, a 90 square meter apartment is considered to be on the larger side for many in Ulaanbaatar.
To address these issues I decided to take another pass at the price to income ratio using more realistic numbers for Ulaanbaatar. Here are the data assumptions I used.
- Median salary, national level, Q2 2021, via 1212.mn: ₮993,600
- The same average price per square meter for apartments, Q2 2021: ₮2,647,076
- 10% Income Tax + 13.5% Social Insurance = Tax rate of 23.5%
- Average apartment size: 62 square meters
- Tenkhleg Zuuch currently considers this the median apartment size in Ulaanbaatar.

The result? 11.99. Nearly identical to the ratio calculated above with average salary and 90 square meters. We can’t directly make a comparison now to New York or San Francisco like we did before. What we can do is draw a general conclusion about apartment affordability for a middle income family for a median sized apartment.
Note: You might think we could simply take the ratio from New York and multiply it by 1.3 (because 62 square meters is about 30% less than 90 square meters). Without knowing whether Numbeo used median or average salary in all circumstances it’s hard to know if we can make a generalized estimate like that.
But what comes next might be more useful.
Zoom in, enhance!
After doing the above calculations I felt that I still had not gotten the full context of the situation. I realized what we needed was a look at the trend of the price to income ratio. In other words, have apartments gotten cheaper or more expensive relative to wages over the past several years?
Luckily I had apartment price data and wage data from 2014-2021. Here are the data assumptions I used to gereate the chart:
- Yearly net salary = Average salary (national level) x (1 - tax rate) x 12
- Average apartment price = Average price per square meter in Ulaanbaatar x 62 square meters
- Price to income ratio = Average apartment price / Yearly net salary

I was fairly shocked by the result. I always heard that families are being priced out of apartments, but this chart tells a different story. In the past 10 years apartments have become more affordable to both average and middle income families. Since around 2019 the trend has leveled off, with salaries and apartment prices rising at a similar rate.
This seems to signal that more recently supply and demand has reached some sort of balance, with the supply of apartments matching the demand in the market.
Does this mean that apartments are “easy” to afford for families? That’s a tougher question that leads us into mortgage territory and the unique properties of the lending market in Mongolia.
We can leave that for another day.
MDS Newsletter
Thank you for reading. Mongolian Data Stories has a free newsletter! To receive new articles straight to your inbox so you never miss out, click here to sign up.


