Which grocery store in Ulaanbaatar is cheapest?
Since moving to Ulaanbaatar in 2013, I’ve been to nearly every market in the city. I was struck by the opposite worlds of the zakh and the supermarket. One feels bustling but is arguably less convenient (no carts, very little parking). The other is more structured and has more packaged products but is often lacking in the selection of fresh foods. In some ways it’s indicative of the dichotomy that exists in Ulaanbaatar in general between the new and the old, the urban and periurban.
Zakh (зах) translates to market and is segmented in different areas such as vegetables and fruit, meat, and dry goods. In each area, vendors rent or own stalls where they sell their products. The products in each section are generally the same from stall to stall, with little variation. Cash used to be the only way to make a purchase, but more recently, card machines have become quite common (even preferred!).
A supermarket in Ulaanbaatar is pretty comparable to western supermarkets. Aisles of products with often many choices for each product. The main exception is the meat section. I’ve noticed that most supermarkets in Ulaanbaatar don’t stock much fresh meat, and if they do the selection is quite small (except Emart, which has a quite large meat section).
Even casual observers will note that prices in a zakh are lower than in supermarkets. Most of us only have a limited sample to work with, which means our observations are limited. Fortunately, the National Statistics Office of Mongolia tracks weekly prices for several products at all major supermarkets and zakhs in Ulaanbaatar. The products tracked are staple food products (meat, flour, bread, butter, eggs, etc.) that are most common in households. My understanding is this data feeds into consumer price index (CPI) inflation calculations based on the basket of goods identified by the government.
Don’t know what a “basket of goods” is? Imagine a shopping cart for the whole country. What set of products would nearly every family choose to purchase for their home? Probably basics like flour, eggs, milk, bread, meat, potatoes, carrots, and a few others. This set of products is then tracked to understand both CPI and can also be used to assess things like the poverty line, cost of living, and others.
You probably aren’t aware of this data source, as it is available only on the Mongolian 1212.mn page and also under a menu that might not grab your attention. If you are interested, check it out here.
I identified three questions I wanted to answer while looking at the data.
- Which markets are most/least expensive over time?
- Did COVID-19 have a noticeable impact on prices?
- Do markets use psychological pricing? For example, carrots for 1,899 instead of 1,900 tugriks.
So, let’s get to it!
What markets and products do the data cover?
To collect the data, I built a scraper (link to code) to collect all Excel files from the NSO webpage and merged them into one file. I only selected files after January 1, 2019.
Here is a heatmap showing which products are available at each market around the city. Market names and product names were translated into English.

As you can see, not all products are always available at every zakh or supermarket. Goat meat and reserve meat are two notable items here. Goat meat isn’t always in demand in Mongolia, and reserve meat is only seasonably available depending on the Ministry of Agricultures program to provide low-cost meat.
I merged Mercury and Ikh Nayad as most of the shop keepers from the old Mercury market moved to Ikh Nayad. Also, Max Supermarket changed its name to M Mart, so I’ve reflected that in the chart as well. Saruul is a newer zakh, so there weren’t as many records for it.
From all the products in the chart above, I decided to select the eight common products (in my mind) to make the further analysis simpler and a bit easier to digest. They are:
- Suu Brand Milk, 1L
- Egg, Russian
- Potato, Mongolian
- Carrot, Mongolian
- White Rice
- Atar Brand Bread
- Beef w/Bones
- Mutton w/Bones
There will always be “one more thing” people may want to see in the analysis, but I hopefully covered the most common products. From here, let’s move on to looking at price differences between markets.
Which markets are most/least expensive?
If you live in Ulaanbaatar, I’m sure you already have an opinion about this. Something like,
“The meat is good at Bayanzurkh, but it’s cheaper at Bars.”
Or perhaps something more specific and even devious.
“Emart sells their vegetables for cheaper, but their meat is always the most expensive. But it’s great quality (Because obviously if it’s more expensive, it’s better quality!).”
I’ve never been to a country where people didn’t complain about prices in the store. It’s practically part of the human condition. Personal observations are always made with a limited sample, so let’s step back and see what the data says.
It was tough to figure out how to present this data. I generally prefer to show a time series to give the complete picture and let people decide. Even with only eight products, the time series graphs were confusing, and there wasn’t much of a clear point. I wanted to take a different approach.
A dumbbell chart allows you to see the difference in two times of several things all in one chart. You lose everything between those two times, but it gives a simplified picture that is much easier to digest than a line plot.
I created one chart for each of the eight products I selected. Each chart shows the difference in price from November 2019 to November 2021 for each market. This allows you to see how prices have changed and which markets are cheaper or more expensive between these two times.
Let’s take of look to see how eggs have changed in price over the past two years.

You can see that the price of eggs has increased. Supermarkets are also clearly more expensive per egg. The most expensive supermarket is 25% more expensive than several of the zakh’s.
I built a dumbbell chart for each of the eight products. Here is a gallery showing each of the charts. You can click on each to see them.


After looking at these, you can come to some pretty easy conclusions. For most products, supermarkets are more expensive than at the zakh. Also, pretty much everything has gotten more expensive in the past two years. The exception is potatoes, specifically at Emart. For some reason, those got cheaper. Insert sinister conspiracy theory here.
I also think it’s worth it to look at the supermarket you usually shop at and ask yourself why you shop there? Are you sensitive to small changes in price, or do you choose your store because of convenience? If you are very price-sensitive, you now have some better information to make your decision. If not, well, then you at least know what the price picture is in other places.
One thing that surprised me is that Emart is not always the most expensive supermarket. It was my observation going into this article, and it didn’t seem to be true. Just keep in mind that our sample of products is limited to a few everyday staple products. Emart may keep prices low for these products to drive customers to the store and then charge higher prices for prepared or packaged food.
Let’s move on to the next question.
Has COVID-19 impacted prices?
There isn’t much to do here besides plot a time series of prices and take a look. Here it is. I’ve excluded meat prices as they are significantly higher than the other prices. The prices in the chart below are the average weekly prices of all markets in the dataset.

Considering that COVID-19 started in 2020 and the first serious lockdown happened in late 2020 in Mongolia, we don’t see much change in prices during that time. What we do see is a pretty significant increase in the past few months. In July 2021, carrots went above their maximum price from the previous two years. For the other products in the list, we see a clear upward trend since around September 2021.
There are many moving pieces to get products from the field to the market, so it isn’t easy to know what is causing the recent spikes. You would expect that you would see the market respond by adjusting prices after an increase in fuel prices or a market shock like a lockdown. This didn’t happen until very recently. I found this very odd.
AI-92 prices increased by 300 MNT per liter in July 2021, so there could have been a delayed impact. Combined with the Chinese border closure, these events could put more pressure on supply by increasing costs and restricting imports. Economists with more knowledge than me of Mongolia’s market dynamic could probably explain this better than me.
Lastly, I wanted to look at how markets price their products and perhaps see whether they use psychological pricing or not.
Do markets use psychological pricing?
Psychological pricing is when a business uses pricing strategies to either make the customer feel better about the product or make the customer believe it’s cheaper. For example, a product could be priced for 1,999 tugriks instead of 2,000 tugriks.
There are several psychological pricing strategies, and honestly, I didn’t want to test all of them for every product. One simple test is to count the frequency of prices that end in a certain number of zeros. For example, a price ending in three zeros would be 1,000, 4,000, etc. This tells us the price is an even thousand. We can repeat this test for one zero (‘0), two zeros (‘00), and three zeros (‘000).
Here are the results for three zeros (‘000).
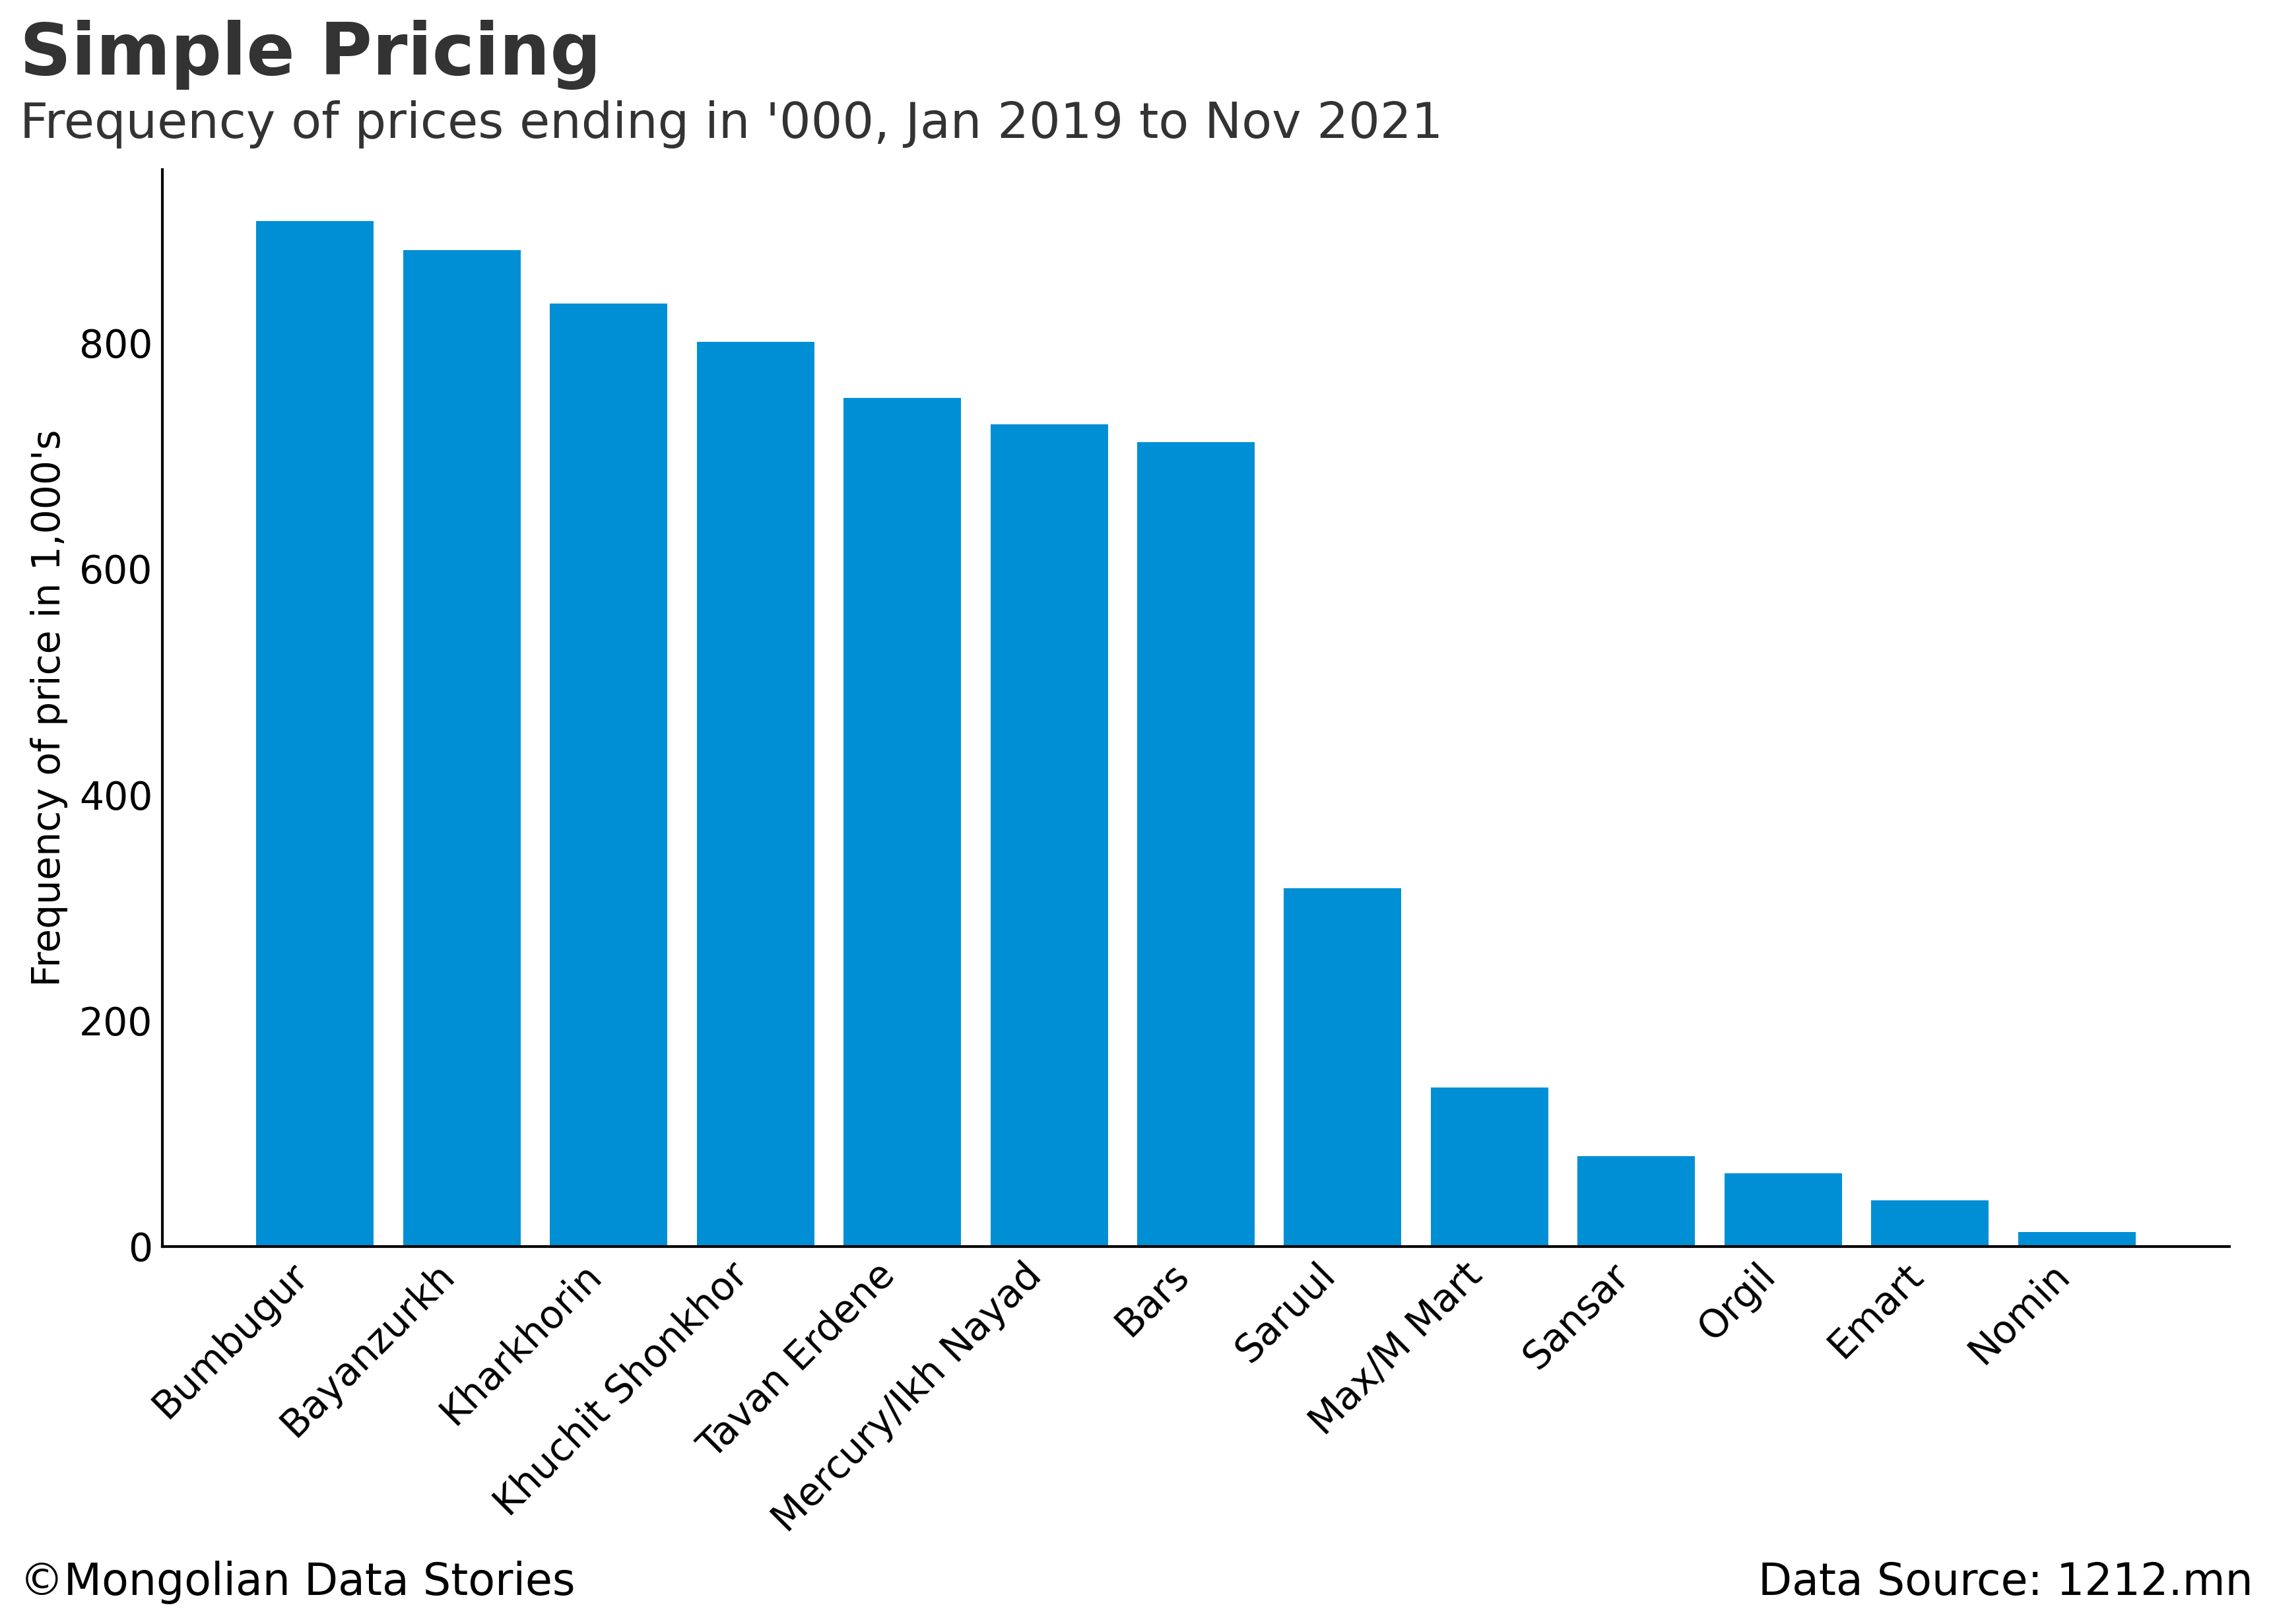
From the chart above, zakhs tend to have prices in the thousands and supermarkets don’t. This intuitively makes a lot of sense, as markets may commonly accept cash, and items are purchased at individual stalls. At supermarkets, items are put into a cart and added up. So the price for an individual product is less noticed at a supermarket than a zakh.
Next, we can look at the frequency of prices ending in two zeros (‘00).

The story here is identical, not much to tell.
Finally, we can look at the frequency of prices ending in one zero (‘0).

The clear psychological pricing outlier of all supermarkets and zakhs in Ulaanbaatar is Nomin. Imagine a product priced at 1,479 vs 1,400. This doesn’t mean much to the consumer, but it could be a significant revenue boost across many products to the store. If 1,000 products are sold a day with an extra 79 tugriks added, that’s 2.37 million tugriks extra each month across many stores. That can equal a significant revenue difference.
Note that Saruul is lower here just because they didn’t have as many records in our data.
Did you change your mind?
After wrapping up this analysis, I can safely say that my mind wasn’t changed much. I mostly knew that supermarkets were more expensive. One thing I did learn was how similarly priced Emart is compared to other supermarkets on many products. Again, I don’t know if this pricing extends to products outside the sample we have, so this might not hold true in general.
What about you? Did you learn anything new with this data?
If you are interested in seeing the code used to collect or analyze the data for this article, you can find it here.
MDS Newsletter
Thank you for reading. Mongolian Data Stories has a free newsletter! To receive new articles straight to your inbox so you never miss out, click here to sign up.


